
Super Suite
Get all extensions for one suite price
Design Extender
Design and create unlimited websites
Data Bridge
Develop database-driven websites
eCart
Build a responsive shopping cart + checkout
MySQLi Server Behaviors
Generate streamlined MySQLi
Free PayPal Toolkit
Paypal, PayPal Credit, and Skype
Help
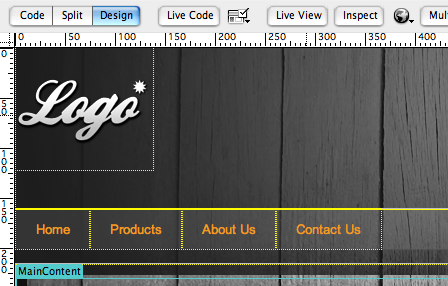
Get a head start on your website by downloading our free Dreamweaver templates. Our free Dreamweaver templates are standards compliant and cross browser compatible.
You can also build your own custom templates with Design Extender, our Dreamweaver extension that helps you design and create unlimited websites. Or start with any Dreamweaver template and add database-driven functionality with Data Bridge and shopping cart/checkout with eCart.
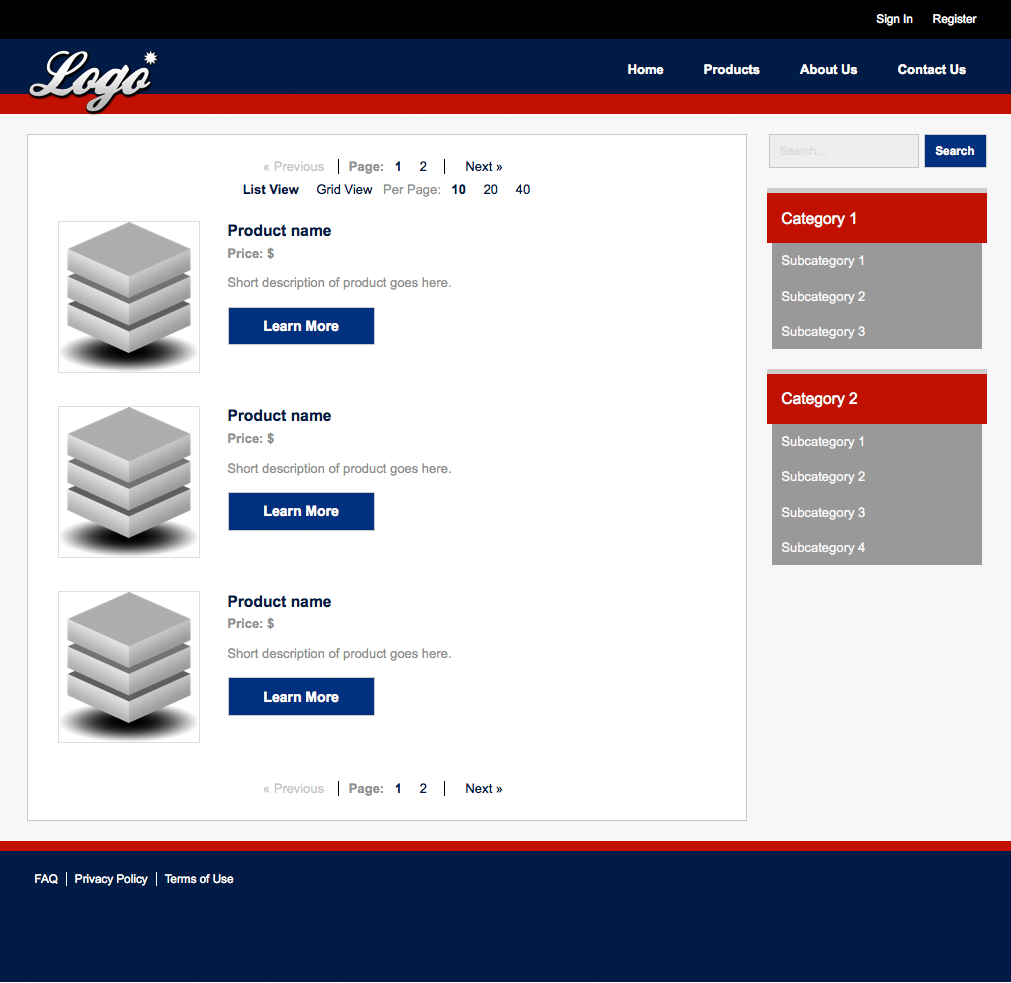
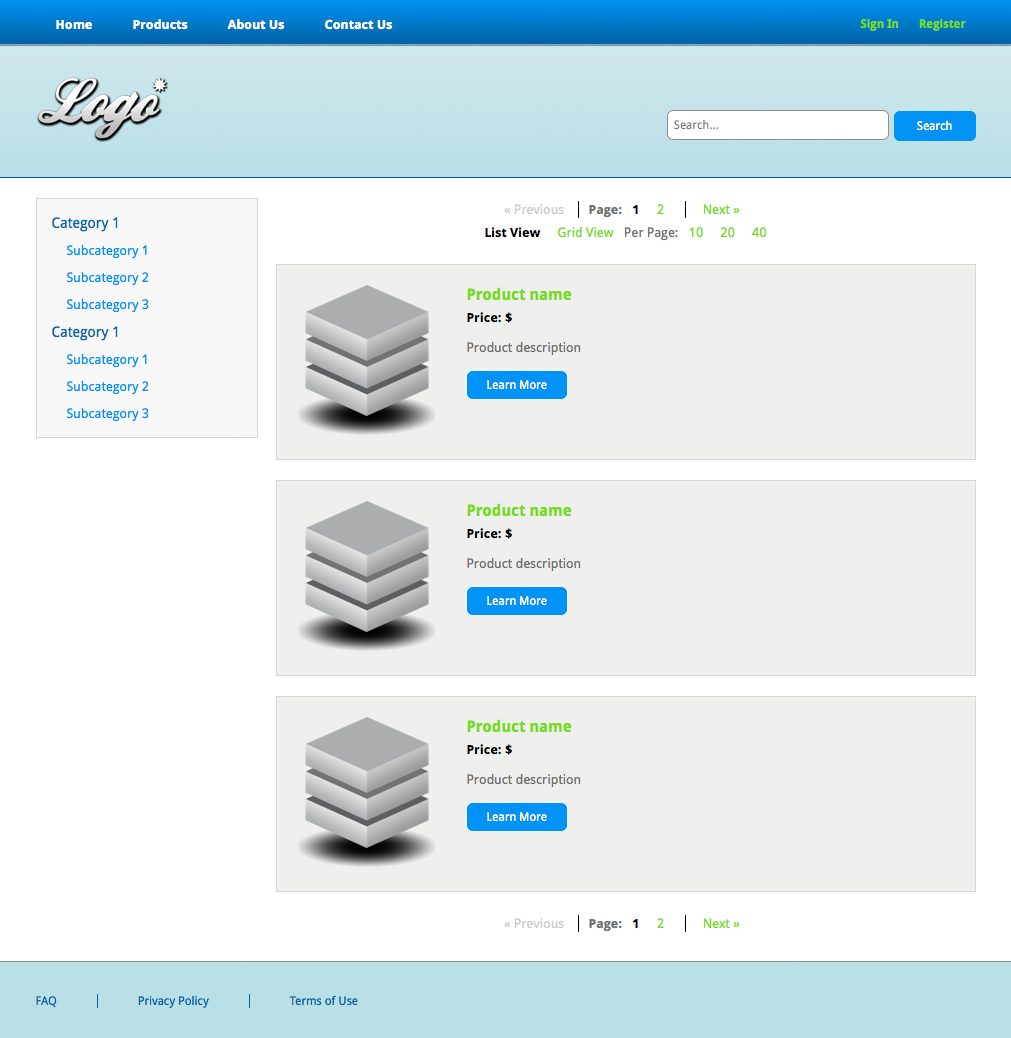
Download this free set of Dreamweaver templates, which includes a home page template and sub page template. Images in this template have been licensed for WebAssist distribution and use by you or your clients.
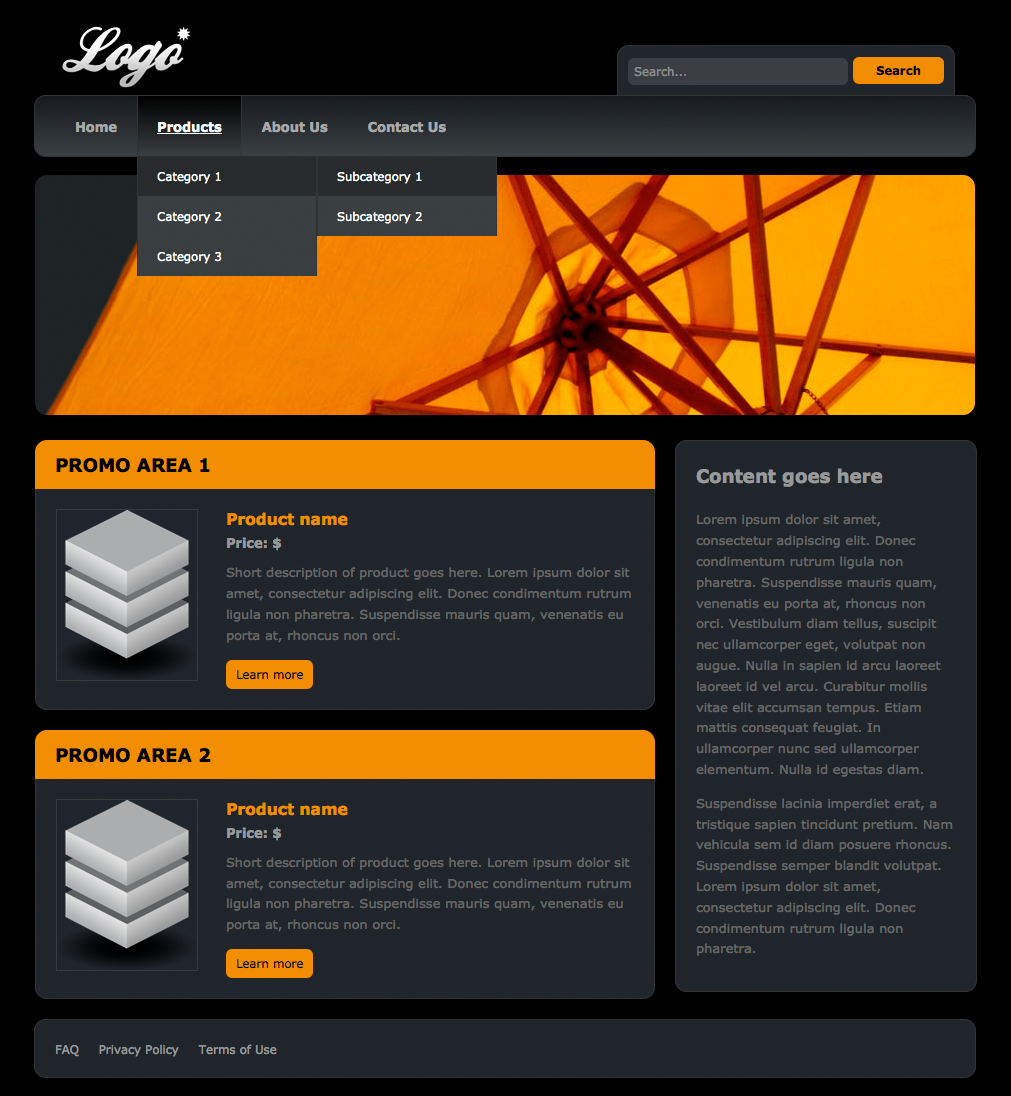
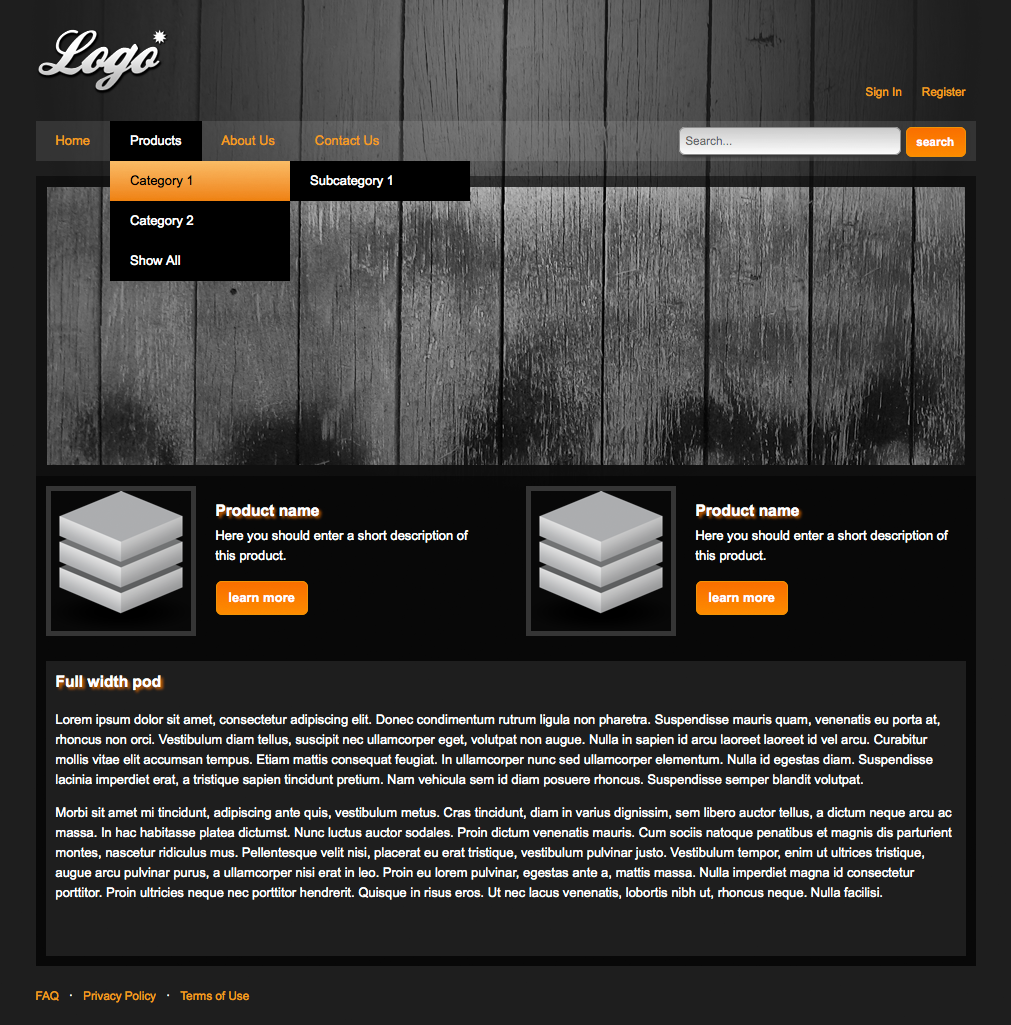
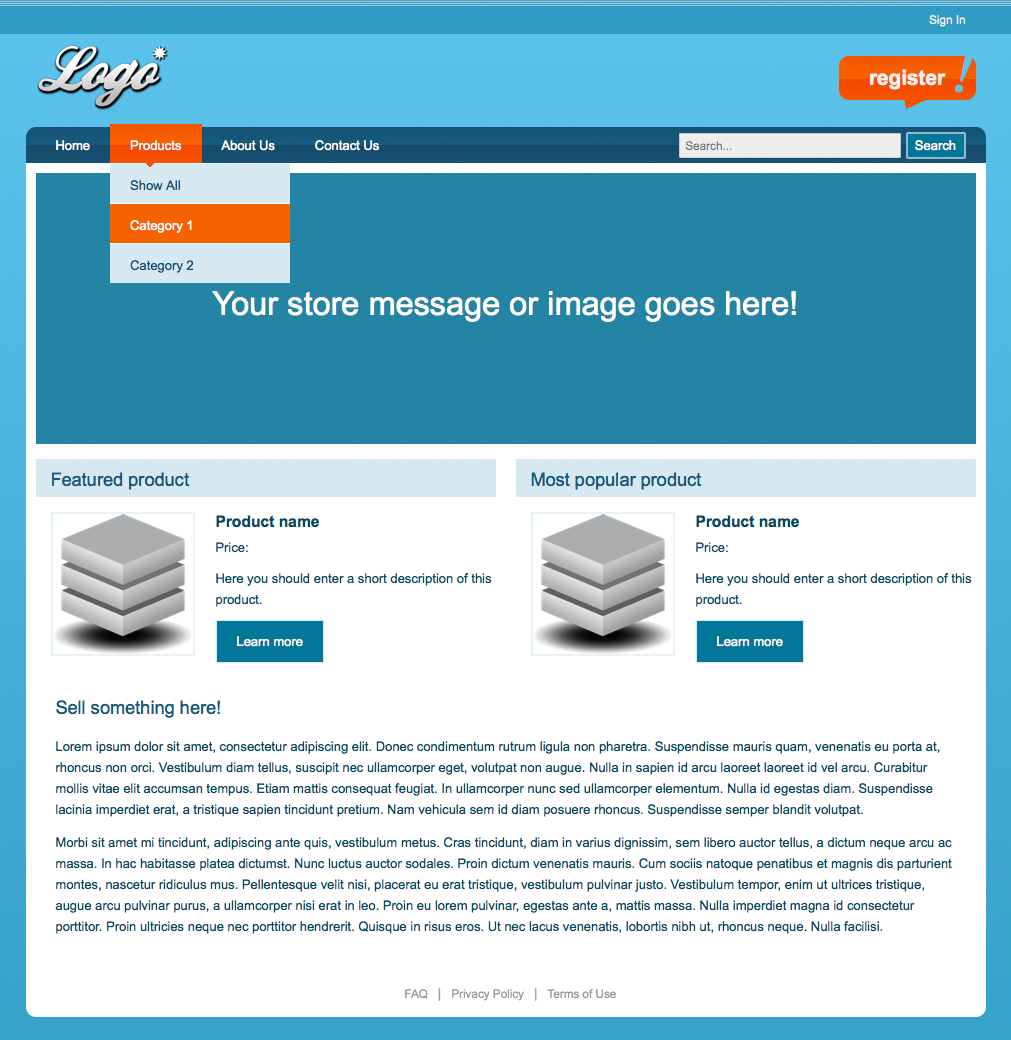
Download this free set of Dreamweaver templates, which includes a home page template and sub page template. Images in this template have been licensed for WebAssist distribution and use by you or your clients.
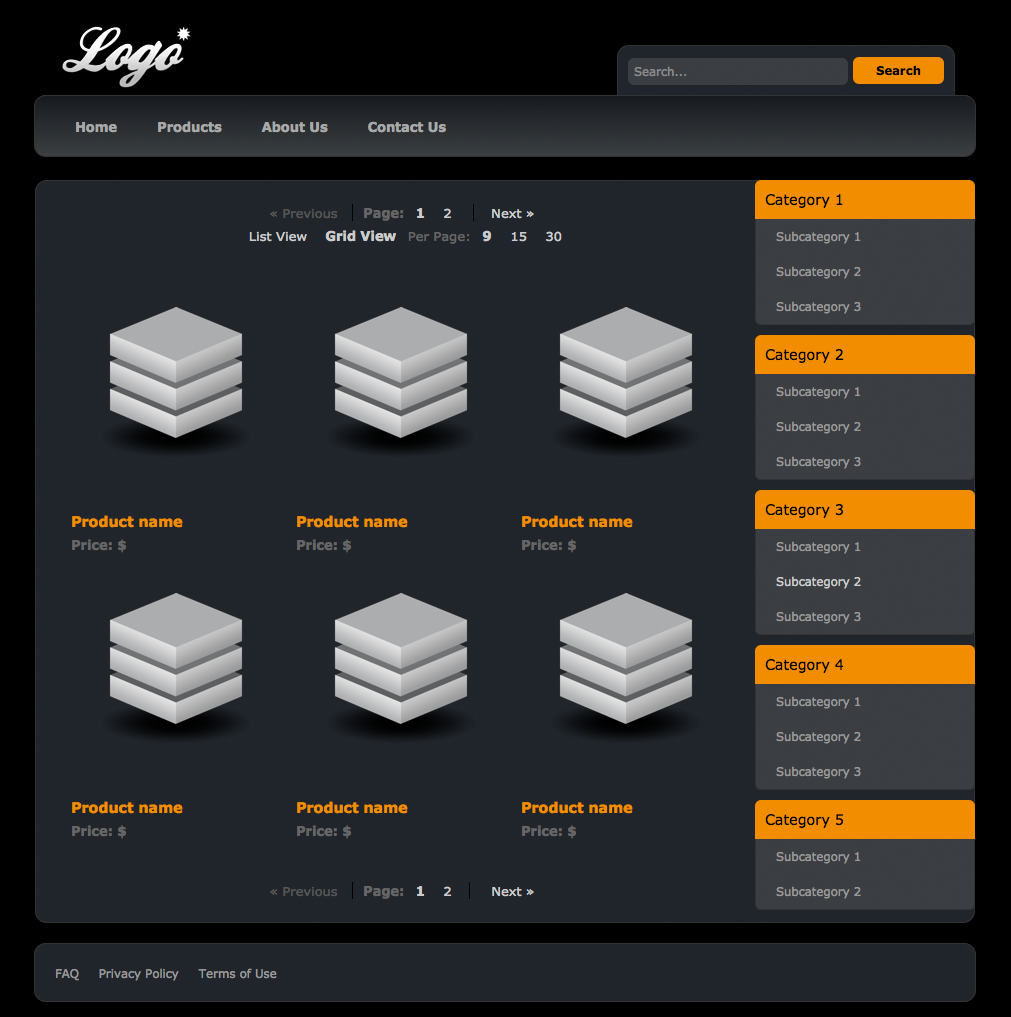
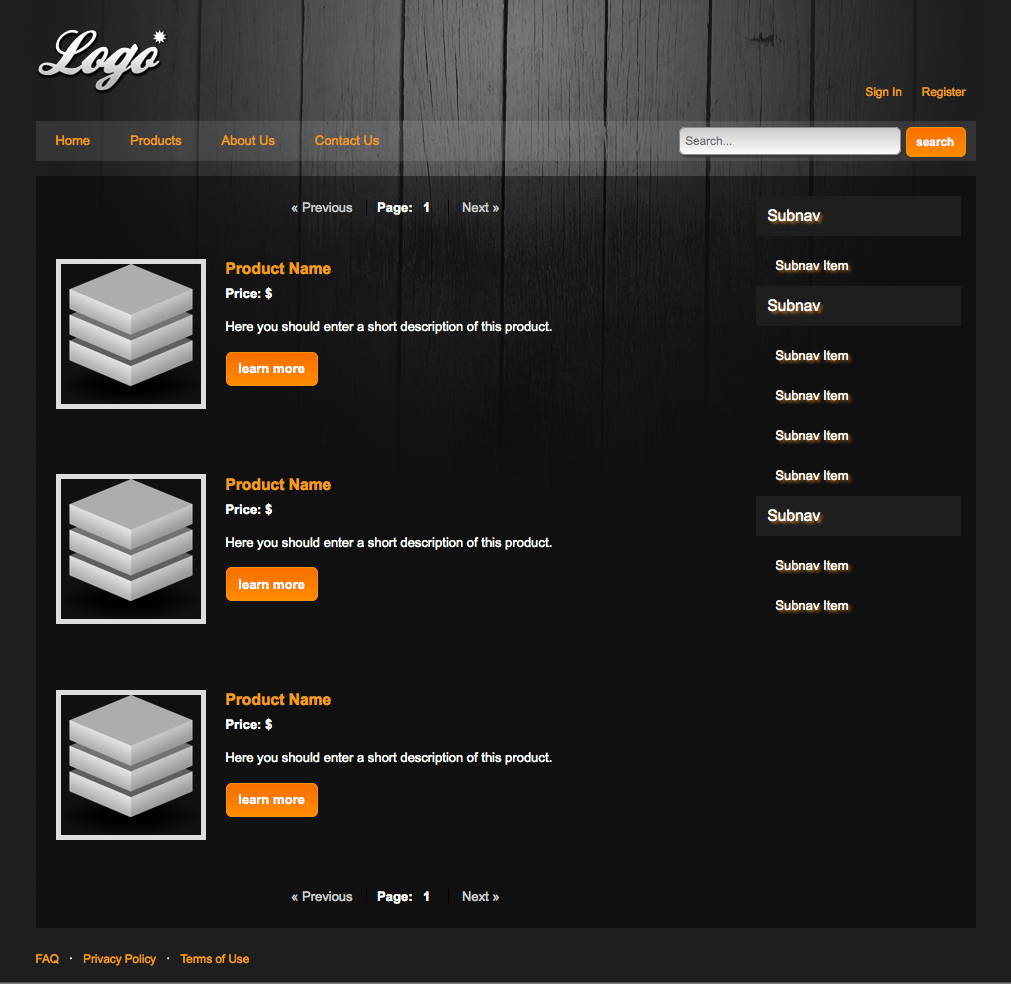
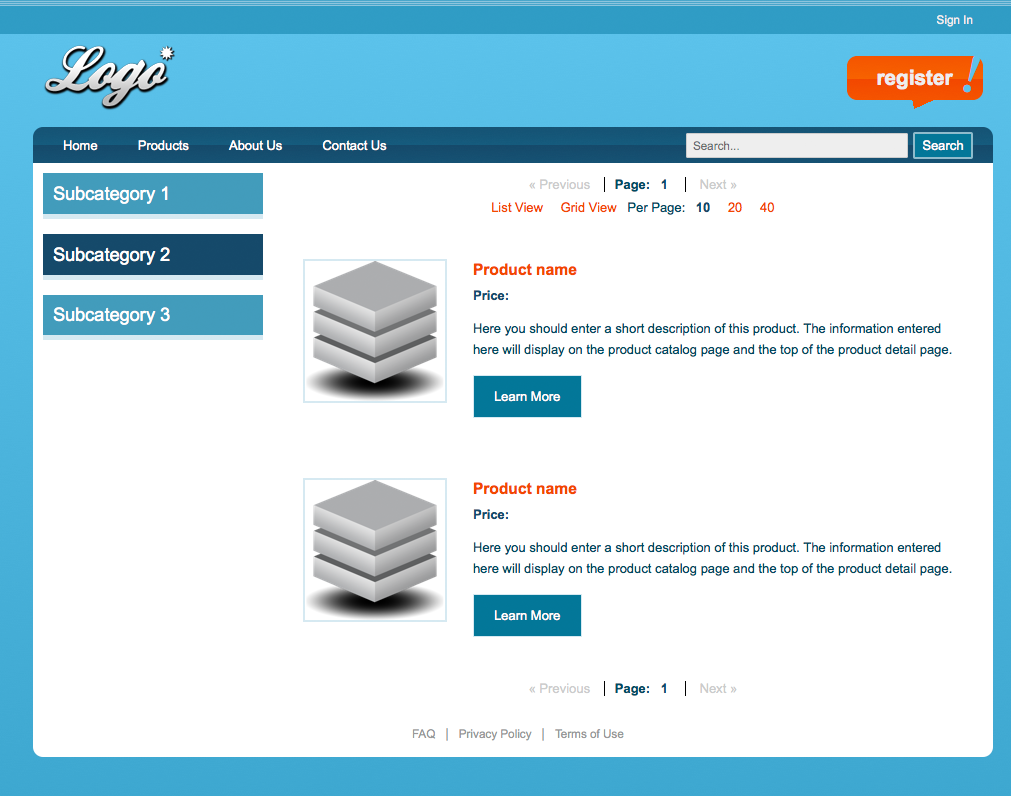
Download this free set of Dreamweaver templates, which includes a home page template and sub page template. Images in this template have been licensed for WebAssist distribution and use by you or your clients.
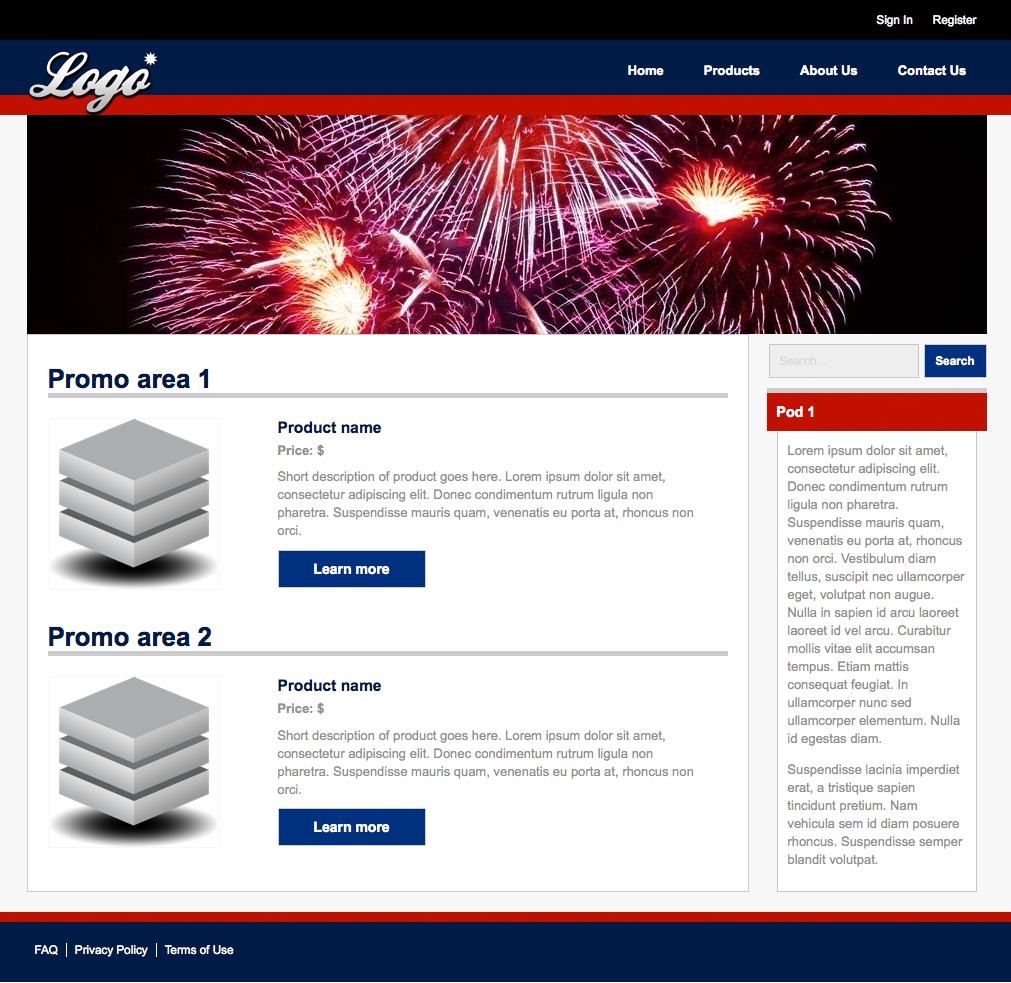
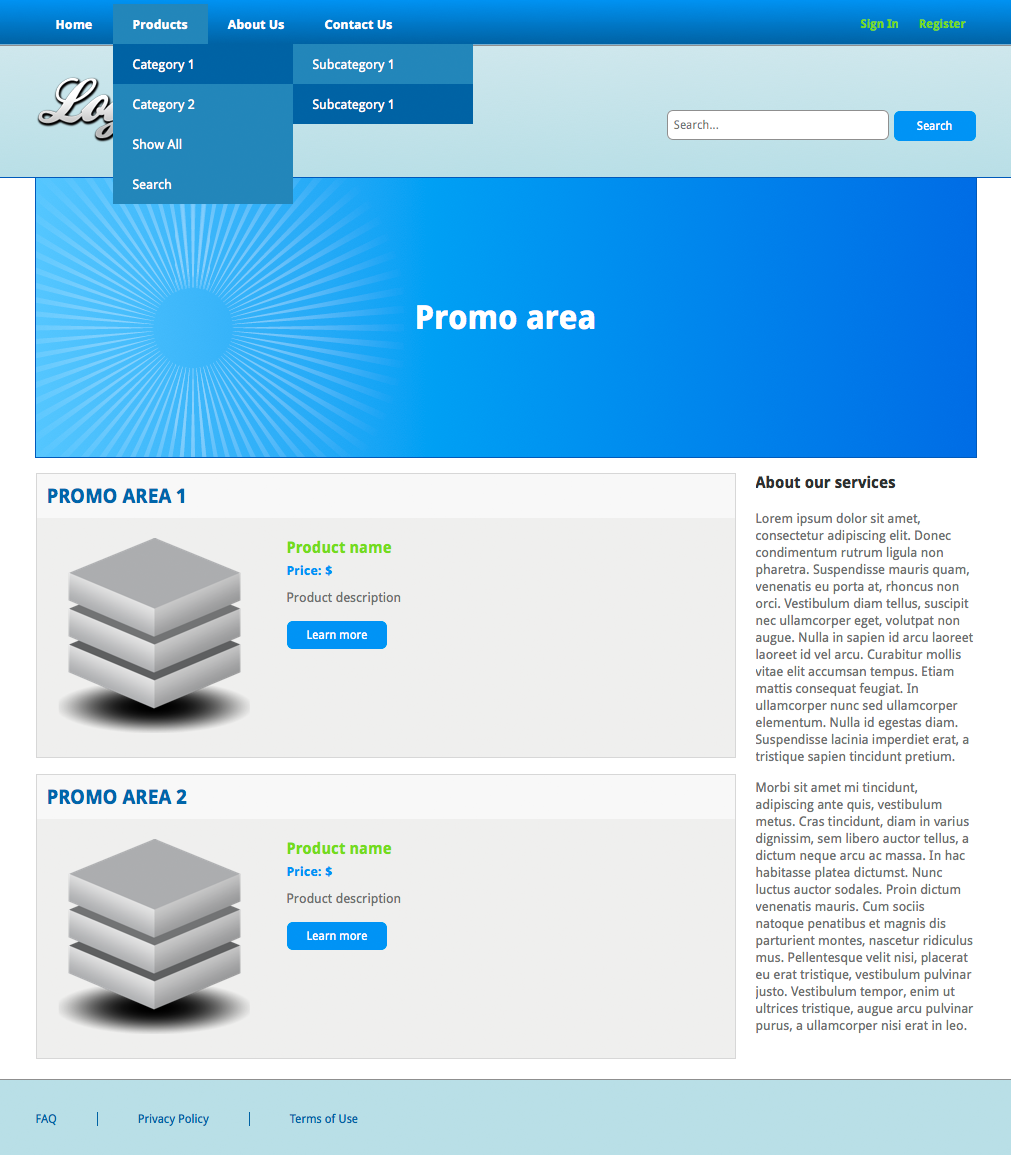
Download this free set of Dreamweaver templates, which includes a home page template and sub page template. Images in this template have been licensed for WebAssist distribution and use by you or your clients.
Download this free set of Dreamweaver templates, which includes a home page template and sub page template. Images in this template have been licensed for WebAssist distribution and use by you or your clients.

This tutorial will educate you on the stages of web development, from planning through to deployment. Great for rookies and experienced developers alike.
This tutorial will teach you how to take a Dreamweaver template and create web pages based on that template.
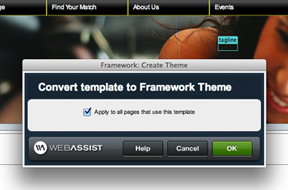
This tutorial will teach you how to convert your template to a theme to streamline your web development. Requires Framework Builder tools.
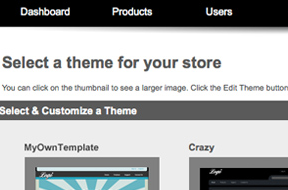
This tutorial will show you how to take one of our Dreamweaver templates and make it compatible with our pre-built store, PowerStore.
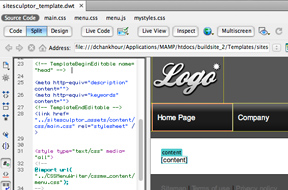
This tutorial demonstrates how to take one of our Dreamweaver templates and build on it with our website-building tools.

New to Dreamweaver or Dreamweaver extensions? Learn how much you can simplify your web development with our free Dreamweaver extension.
Your friends over here at WebAssist! These Dreamweaver extensions will assist you in building unlimited, custom websites.
These out-of-the-box solutions provide you proven, tested applications that can be up and running now. Build a store, a gallery, or a web-based email solution.
©1999-2026 WebAssist.com Corporation. All rights reserved and all that jazz.

Account or customer service questions?
Please user our contact form.
Need technical support?
Please visit support to ask a question